
01
Energy and water
Identify deviations before they become the norm
Compare consumption across buildings, examine changes over time and use the data to prioritise where specialists should investigate further.
Read related articles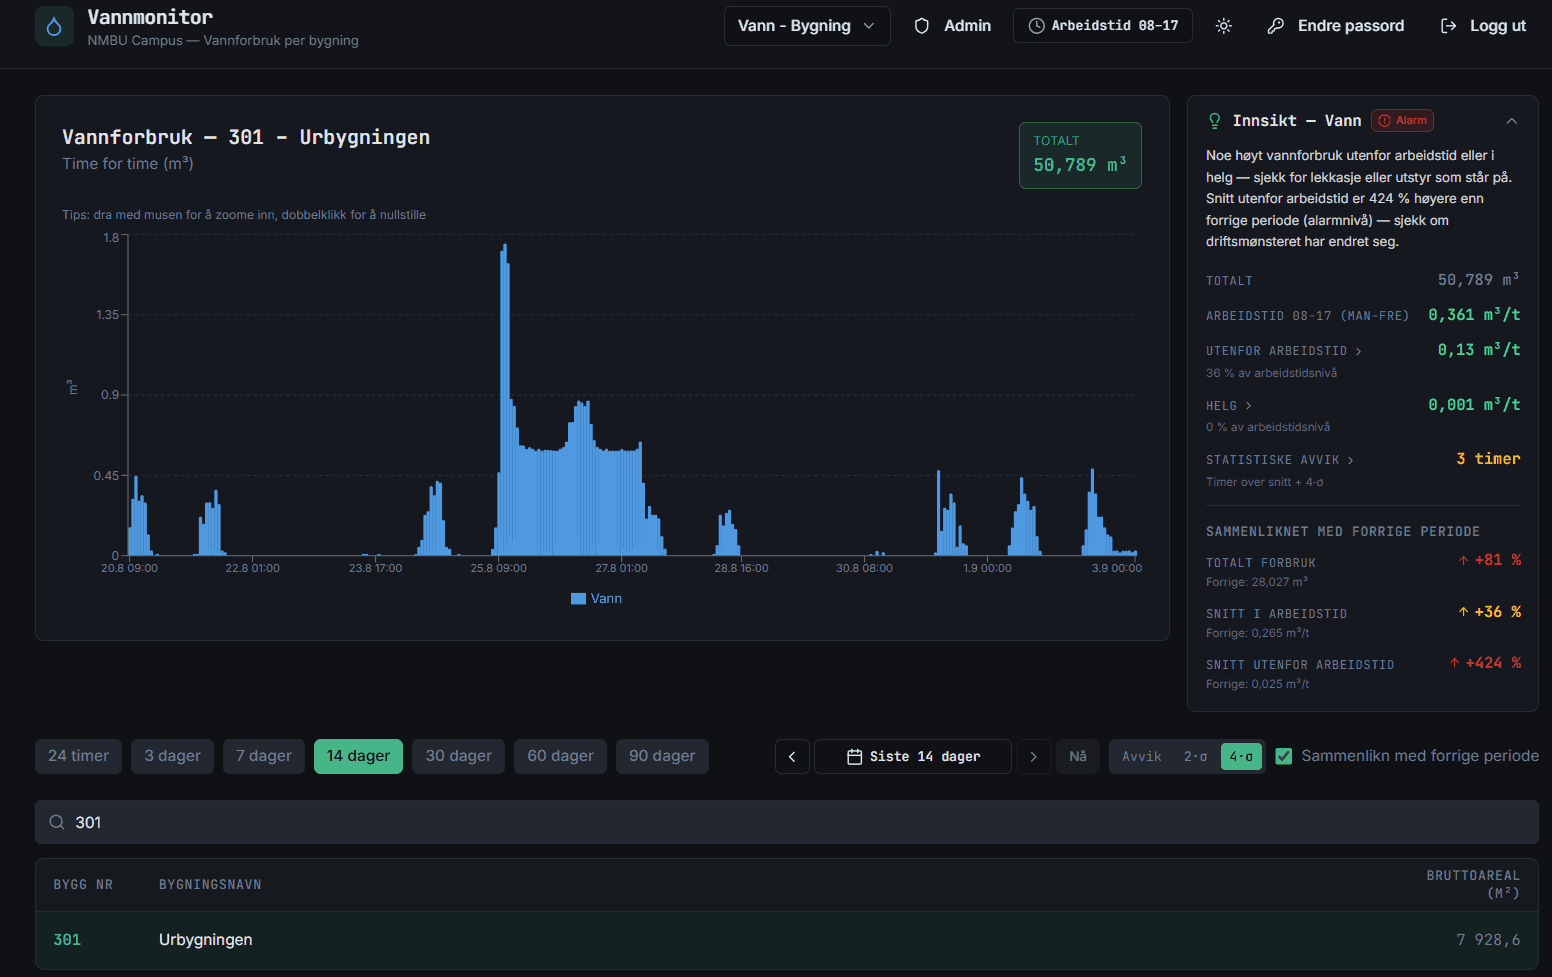
Solutions
SC Insight is the workspace built on the Smart Campus platform. It makes data from buildings and systems easier to investigate, compare and use in professional decisions.
SC Insight
The workspace is developed for invited users at NMBU. It connects a campus overview with thematic analyses, letting specialists move from the portfolio level to buildings, rooms and technical systems.
Energy and water
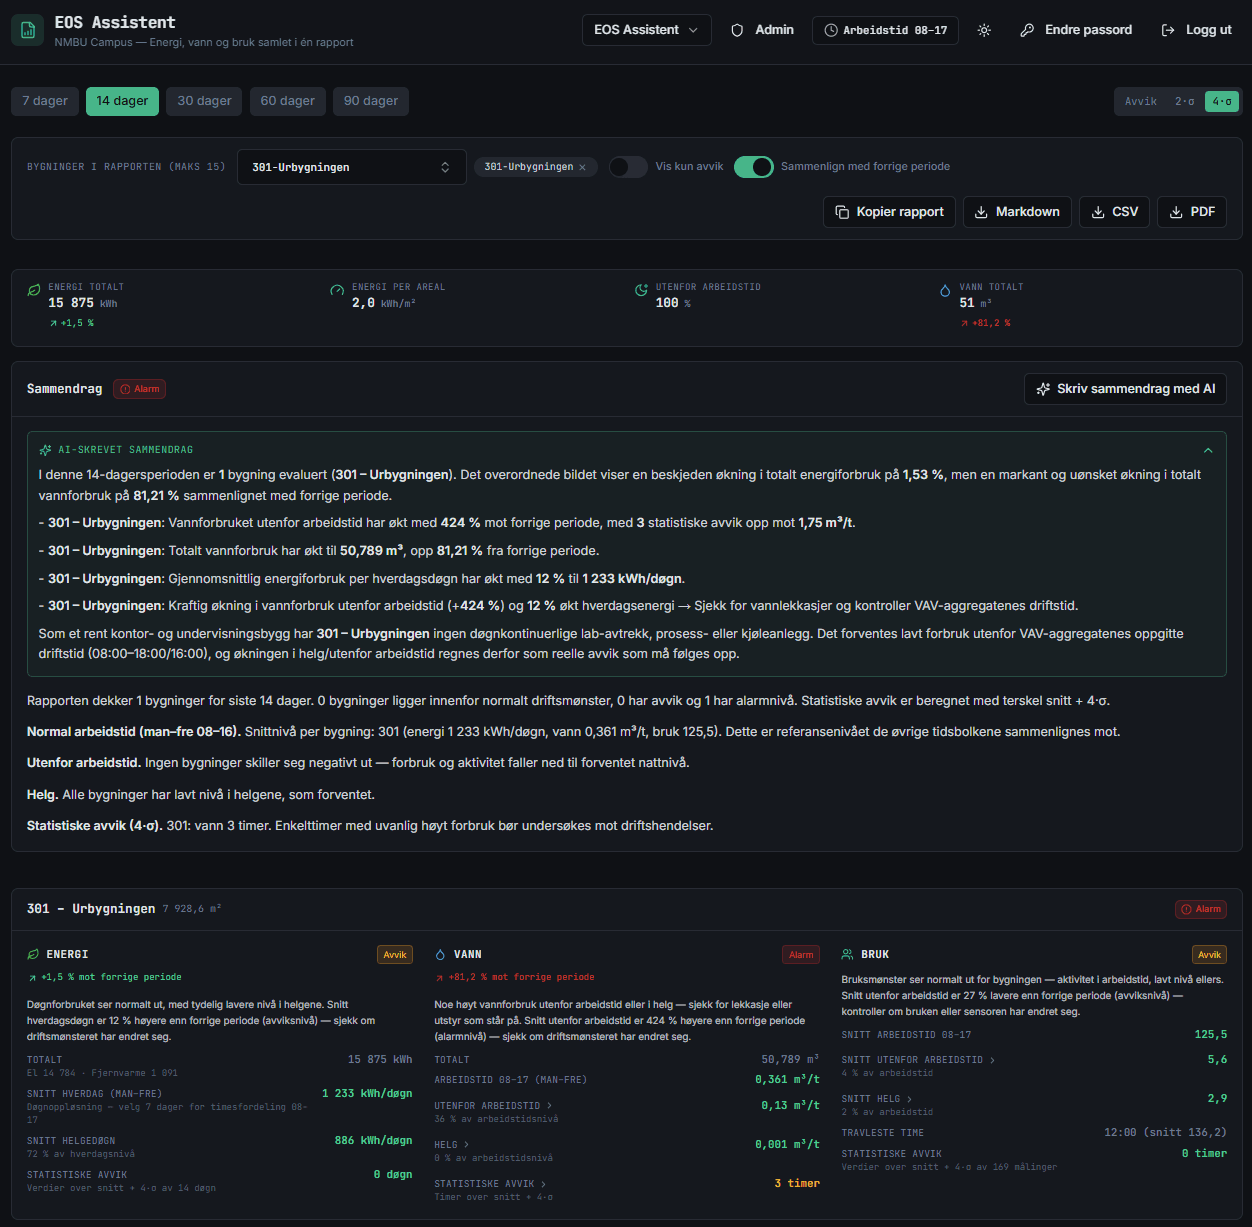
Compare consumption across buildings, examine changes over time and use the data to prioritise where specialists should investigate further.
Read related articlesRoom use and indoor climate
Connect bookings, recorded activity, temperature and CO₂ to the same room, without treating any single data source as definitive.
Read related articles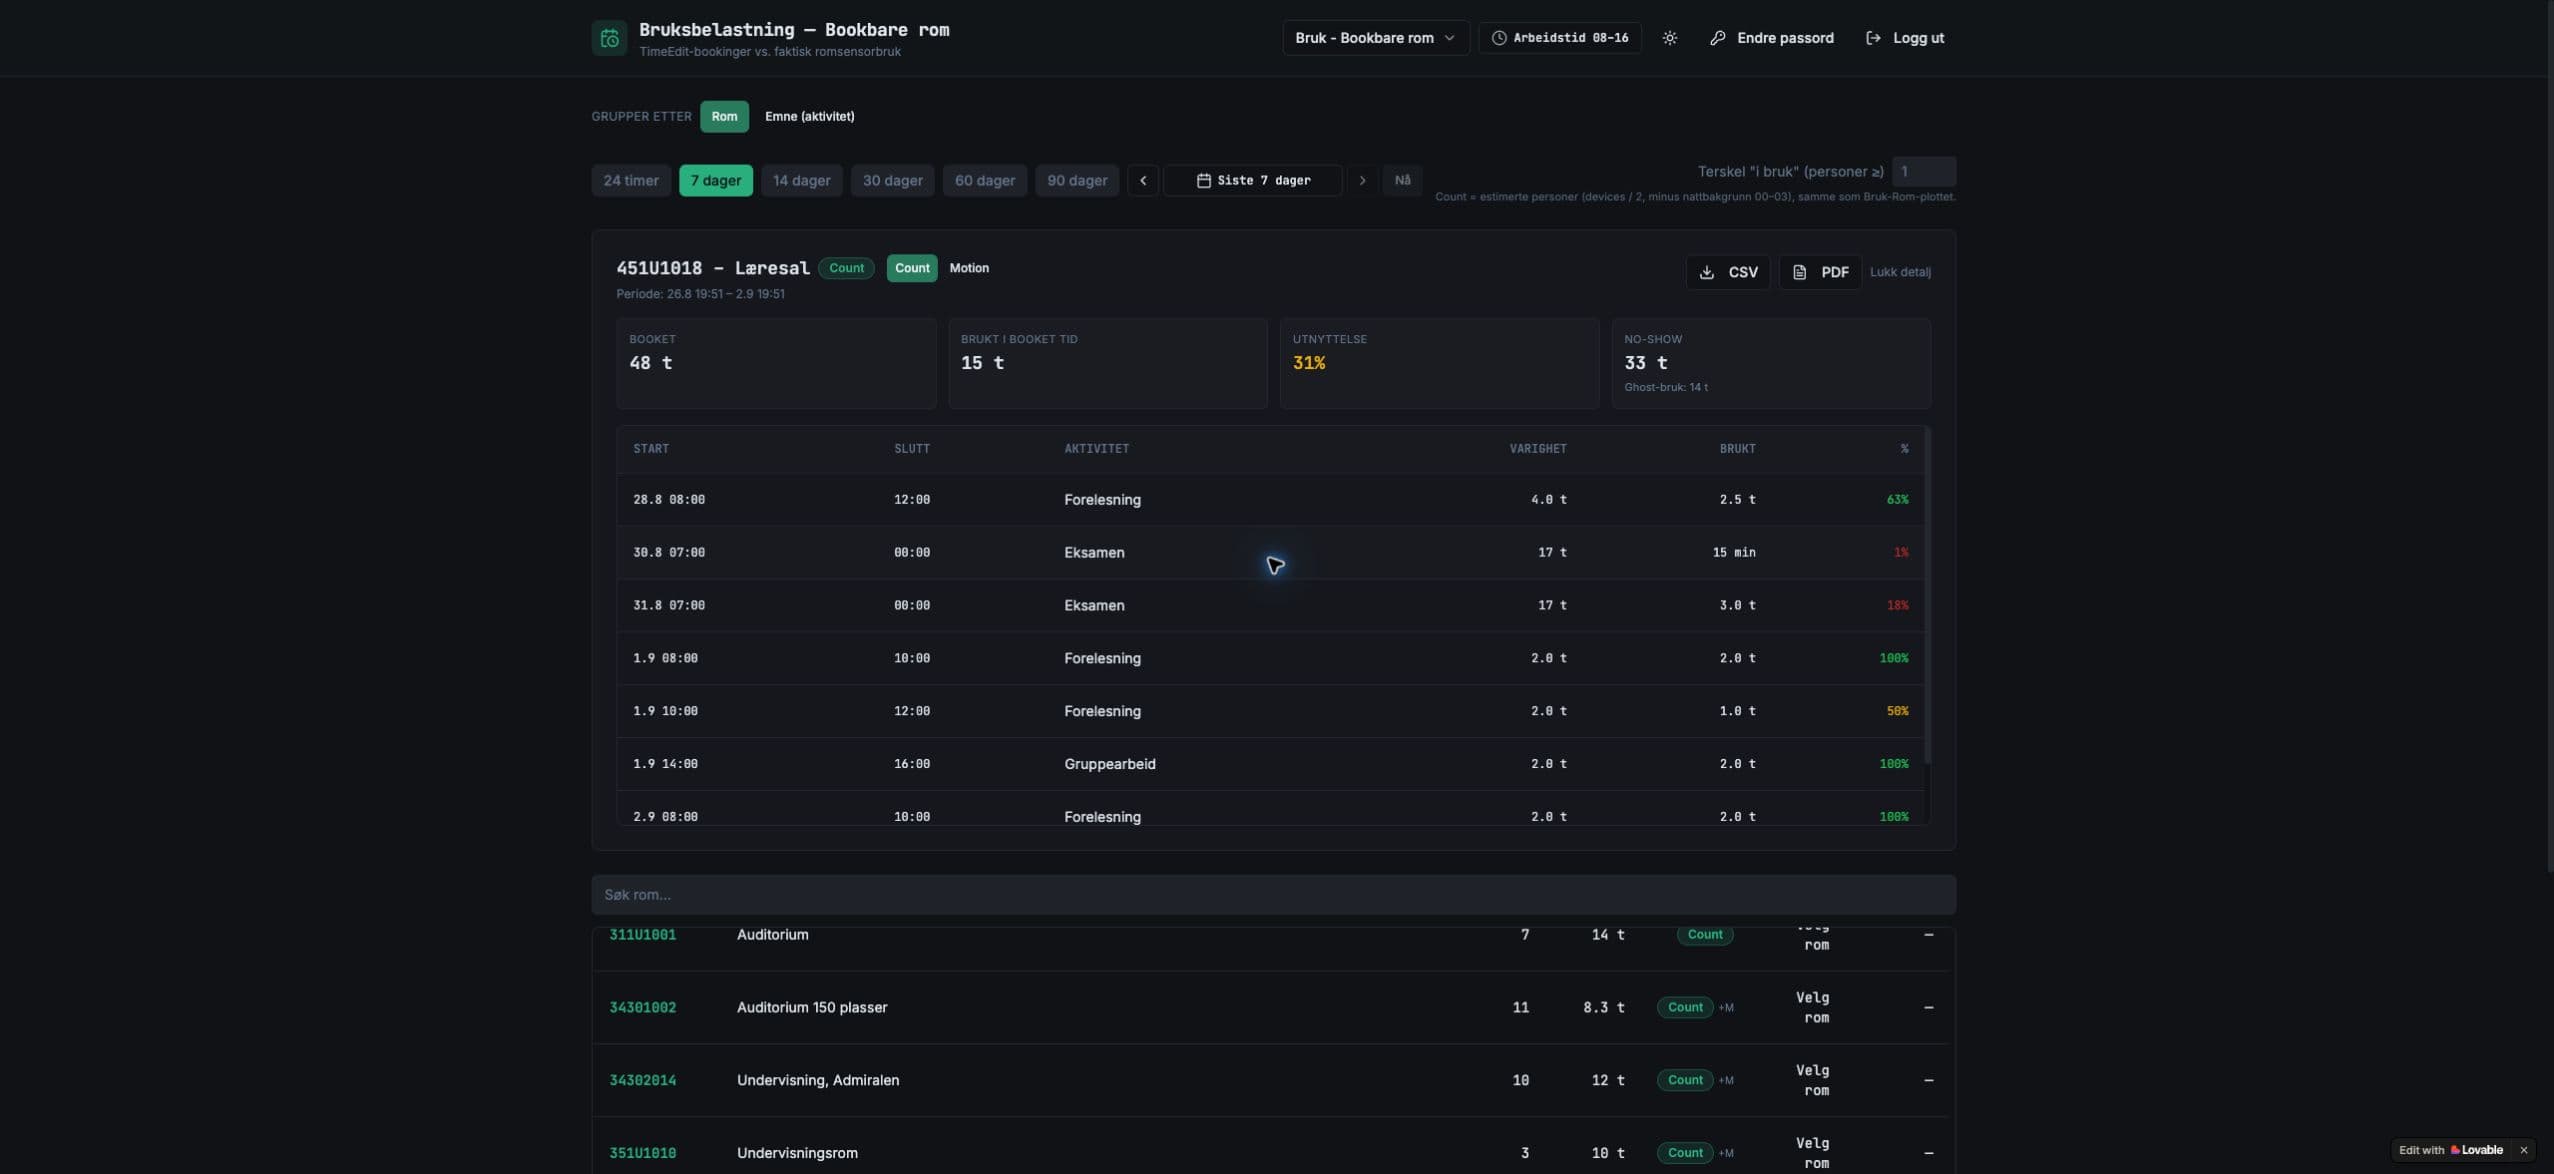
Ventilation
Bring together temperatures, air flow rates, operating hours and key figures to make technical patterns easier to investigate.
Read related articles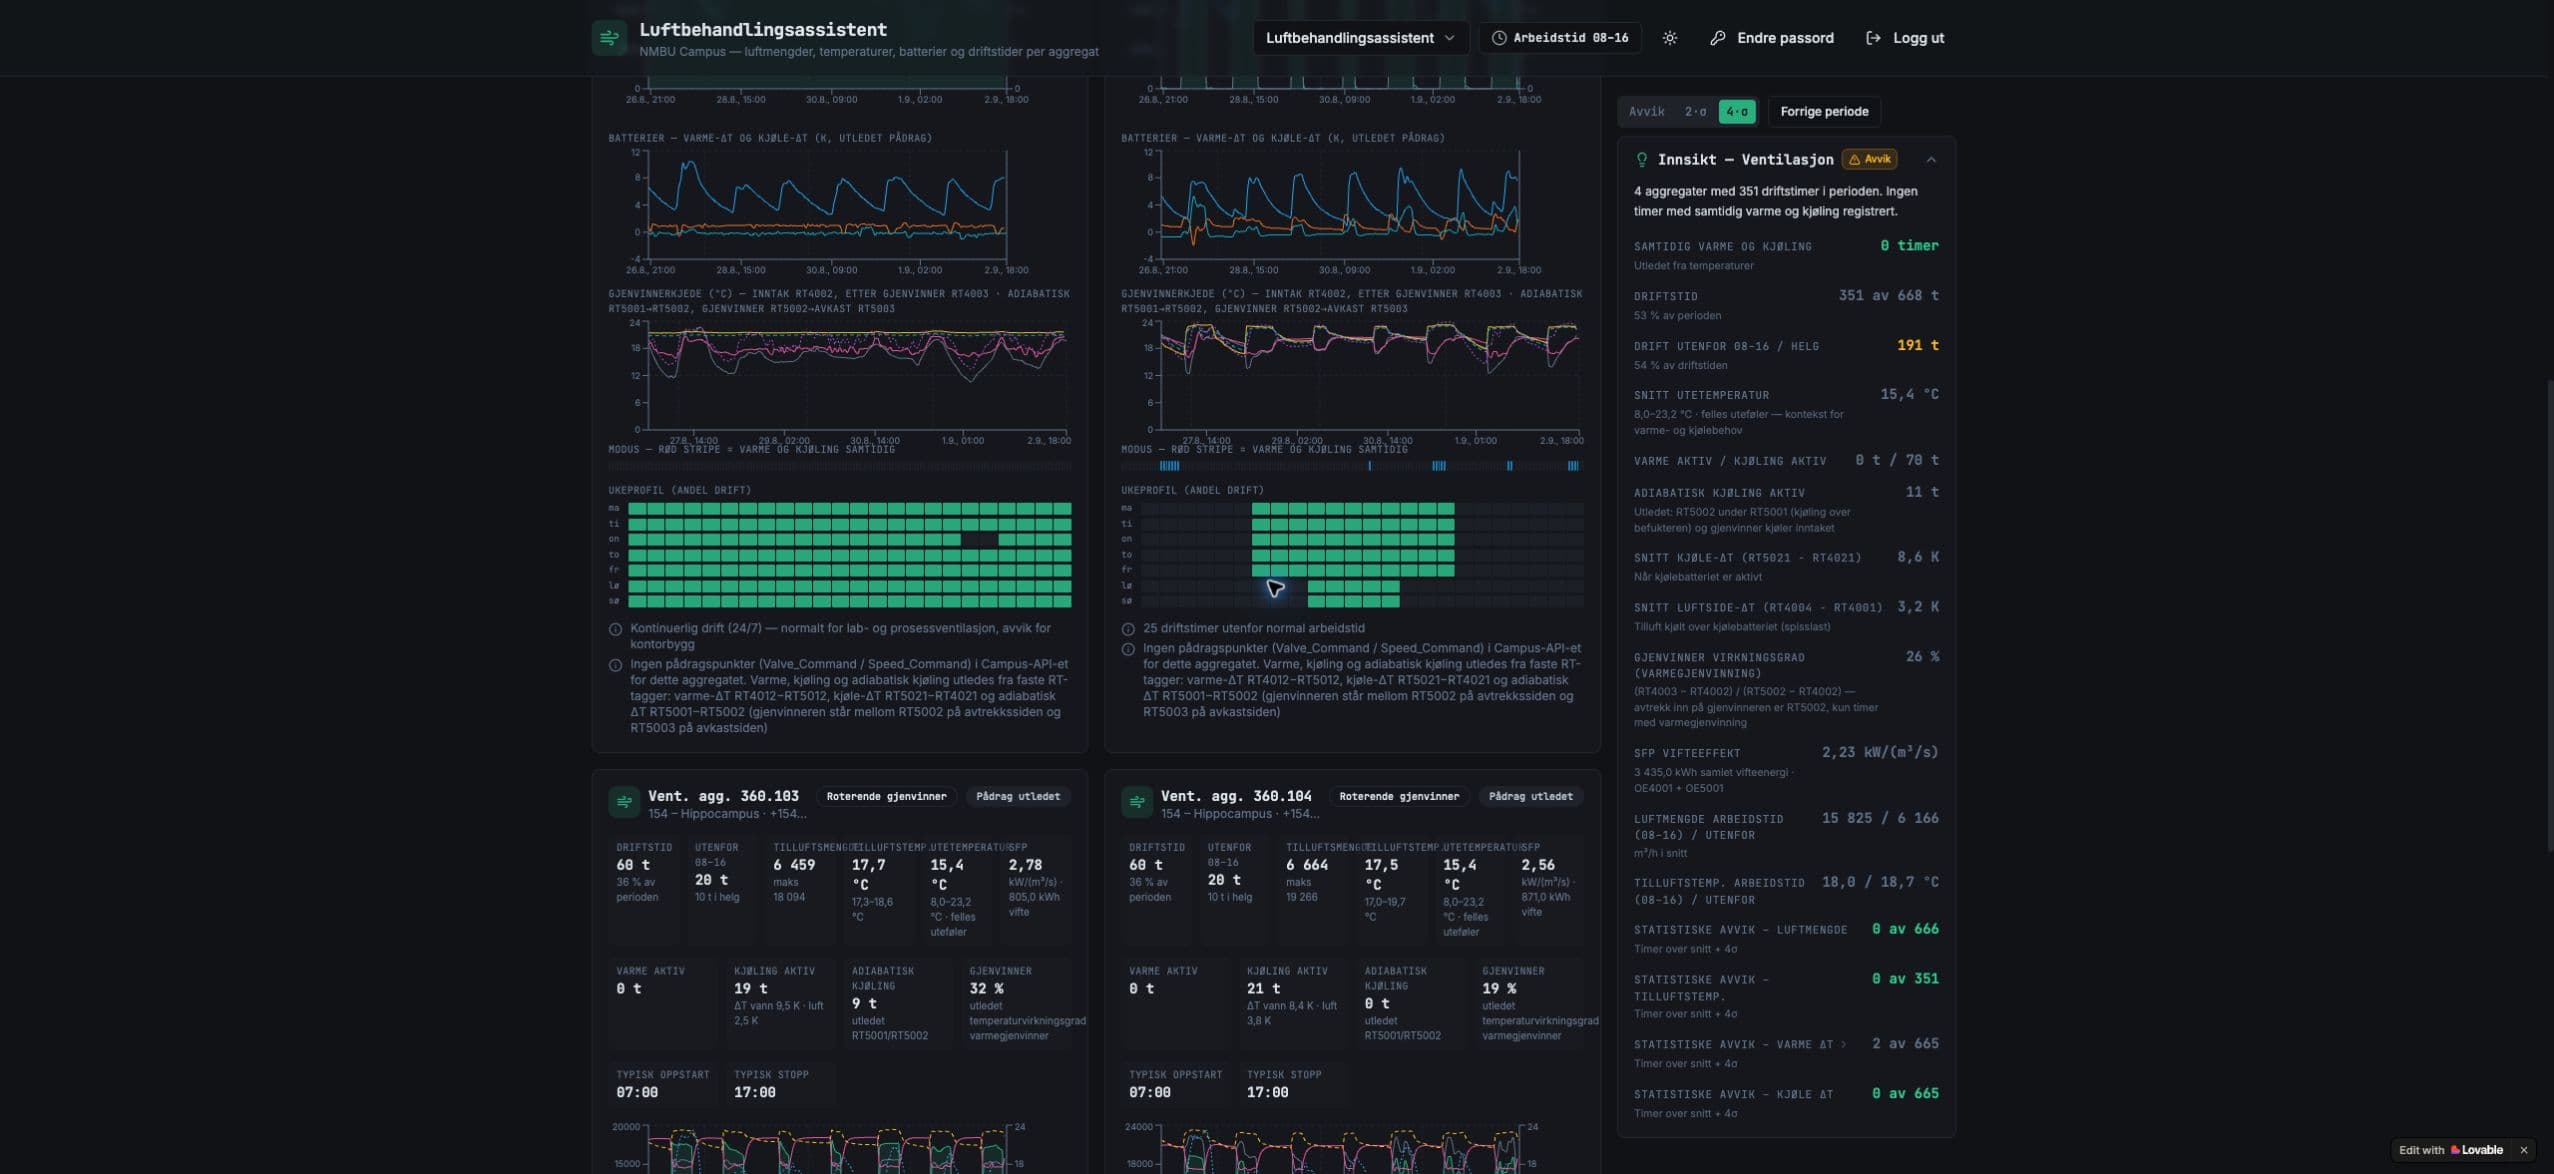
NMBU’s illustrative calculations
The figures below are calculated opportunities from a presentation on predictive operations at NMBU. They describe potential, not savings already achieved or guaranteed.
To realise value, predictions about space use, energy consumption and service needs must be combined with the right expertise, domain knowledge and informed professional leadership.
View the LinkedIn post (in Norwegian)6.3 GWh/year
An illustrative calculation based on a 15% reduction in heating and ventilation gives an estimated NOK 8–12 million per year, using NOK 9.4 million as the estimate.
107.1 tonnes
The presentation calculates a 15% reduction as 107.1 tonnes of CO₂ equivalent per year for NMBU.
NOK 1,295/m²
Annual cost basis for cleaning and operations. The presentation also gives NOK 1,931/m² for refurbishment as a basis for decisions about space.
NOK 4.3 + 9.2 million/year
The illustrative calculation shows a 20% efficiency improvement in cleaning at NOK 4.3 million per year and potential savings of NOK 9.2 million per year in operations.
NOK 0.2 million/year
A calculated saving of 15%. Indirect effects such as longer service life, less downtime and fewer consequential failures are not included in the figure.
Other possible benefits include better targeted cleaning and operations, freed-up capacity, longer equipment life, less downtime and lower prices when procurement and repairs can be planned. These effects are not quantified in the illustrative calculation.
For administrators
The Admin application is used to work with the platform’s data sources, integrations and connections. Access requires registration in NMBU’s Microsoft environment.