
Room use and indoor climate ·
Cisco Firehose API: from network data to insights into campus use
Continuous counts of network devices provide a basis for exploring patterns of use across buildings and floors. Smart Campus NMBU connects this data to digital twins and historical records.

Open the full-size figure (new tab)
Historical screenshot from Cisco Spaces, 6 January 2025. The chart shows recorded devices, rather than a direct count of people.
The campus network can provide information about how buildings and floors are used throughout the day. Cisco Firehose API is an interface that streams updates about devices on the network. In Smart Campus NMBU, this data forms part of a shared data foundation for the buildings.
From daily files to continuous updates
The project previously retrieved daily CSV files from Cisco Spaces. With Firehose API, updates arrive continuously. Messages of type DEVICE_COUNT provide counts of recorded devices, which are linked to buildings and floors in the platform.
The data passes through Azure Event Hubs and Azure Functions to Azure Digital Twins. The administration app links the sensor twins to the correct building and floor. Historical data is stored as time series in Azure Data Explorer and made available through a standardised API based on RealEstateCore, a model for building data.
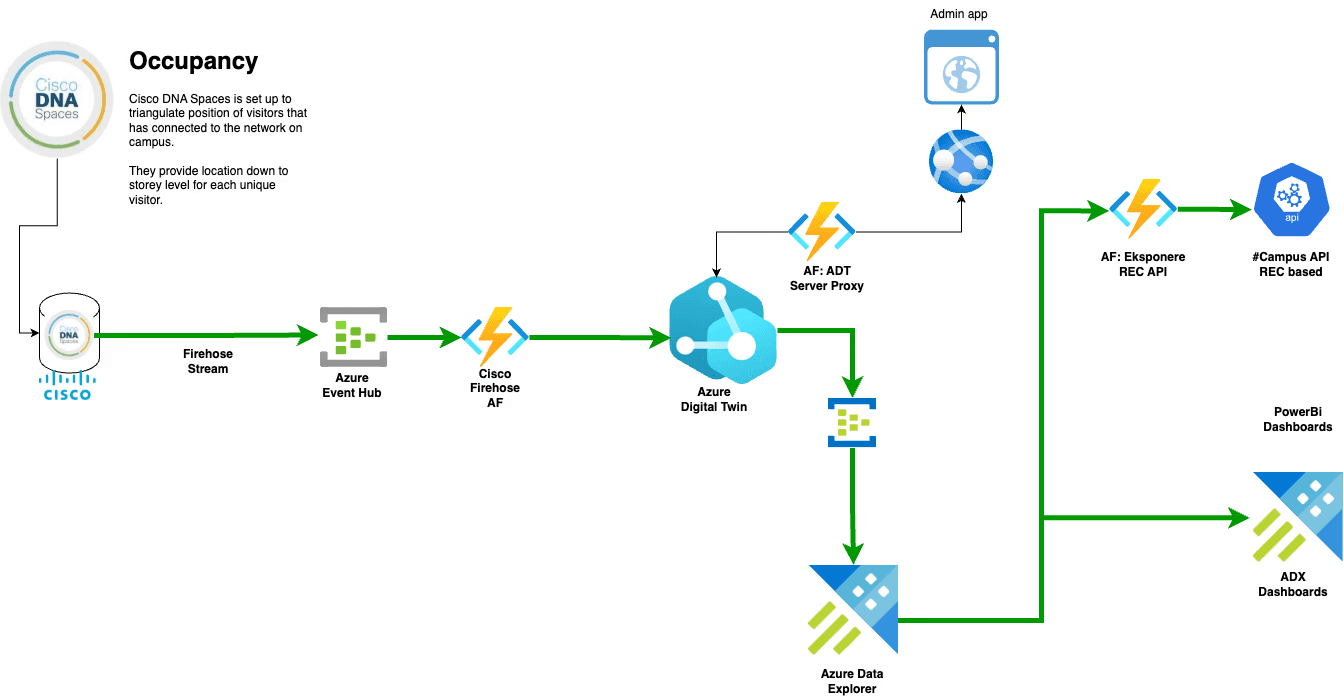
The integration architecture from the original article. Open the full-size diagram.
More useful alongside other building data
Viewed alongside booking information, energy consumption and building automation data, network data can help explore differences between planned use, recorded activity and operating schedules. This can inform assessments of space use, cleaning and heating.
Device counts indicate activity; they are not a reliable count of people. One person may carry several devices, and the network also records other equipment. Coverage, data quality and local context therefore need to be assessed before the data informs action. Value comes from connecting the signals to the correct building and professional judgement, then following up on the effects of any changes.